Docker Swarm instrumentation with Prometheus
Swarmprom is a starter kit for Docker Swarm monitoring with Prometheus, Grafana, cAdvisor, Node Exporter, Alert Manager and Unsee.
Since its inception at SoundCloud, Prometheus has been a rising star in the infrastructure monitoring space. With the 2.0 release coming up, I would say Prometheus is one of the best open source monitoring system and time-series databases out there. The project is currently hosted by the Cloud Native Computing Foundation and has become the default monitoring solution for Kubernetes and its commercial flavors like Tectonic or Open Shift. The Docker team has plans to integrate Prometheus by exposing Docker engine and containers metrics. This feature is under development, you can track its progress under "metrics: prometheus integration road map" on the Moby project.
If you are planning to use Docker Swarm in production, Prometheus could be the perfect candidate for monitoring your infrastructure and applications.
Install
Clone this repository and run the monitoring stack:
$ git clone https://github.com/stefanprodan/swarmprom.git
$ cd swarmprom

ADMIN_USER=admin \
ADMIN_PASSWORD=admin \
SLACK_URL=https://hooks.slack.com/services/TOKEN \
SLACK_CHANNEL=devops-alerts \
SLACK_USER=alertmanager \
docker stack deploy -c docker-compose.yml mon
Prerequisites:
- Docker CE 17.09.0-ce or Docker EE 17.06.2-ee-3
- Swarm cluster with one manager and a worker node
- Docker engine experimental enabled and metrics address set to
0.0.0.0:9323
Services:
- prometheus (metrics database)
http://<swarm-ip>:9090 - grafana (visualize metrics)
http://<swarm-ip>:3000 - node-exporter (host metrics collector)
- cadvisor (containers metrics collector)
- dockerd-exporter (Docker daemon metrics collector, requires Docker experimental metrics-addr to be enabled)
- alertmanager (alerts dispatcher)
http://<swarm-ip>:9093 - unsee (alert manager dashboard)
http://<swarm-ip>:9094 - caddy (reverse proxy and basic auth provider for prometheus, alertmanager and unsee)
Docker engine setup
If you want to use dockerd-exporter you have to enable
the experimental feature and set the metrics address to 0.0.0.0:9323.
If you are running Docker with systemd create or edit /etc/systemd/system/docker.service.d/docker.conf file like so:
[Service]
ExecStart=
ExecStart=/usr/bin/dockerd -H fd:// \
  --storage-driver=overlay2 \
  --dns 8.8.4.4 --dns 8.8.8.8 \
  --experimental=true \
  --metrics-addr 0.0.0.0:9323
Apply the config changes with systemctl daemon-reload && systemctl restart docker and
check if the docker_gwbridge ip address is 172.18.0.1:
ip -o addr show docker_gwbridge
Replace 172.18.0.1 with your docker_gwbridge address in the compose file:
  dockerd-exporter:
    image: stefanprodan/caddy
    environment:
      - DOCKER_GWBRIDGE_IP=172.18.0.1
Grafana dashboards
Navigate to http://<swarm-ip>:3000 and login with user admin password admin.
You can change the credentials in the compose file or
by supplying the ADMIN_USER and ADMIN_PASSWORD environment variables at stack deploy.
Swarmprom Grafana is preconfigured with two dashboards and Prometheus as the default data source.
Docker Swarm Nodes Dashboard

URL: http://<swarm-ip>:3000/dashboard/db/docker-swarm-nodes
This dashboard shows key metrics for monitoring the resource usage of your Swarm nodes and can be filtered by node ID:
- Cluster up-time, number of nodes, number of CPUs, CPU idle gauge
- System load average graph, CPU usage graph by node
- Total memory, available memory gouge, total disk space and available storage gouge
- Memory usage graph by node (used and cached)
- I/O usage graph (read and write Bps)
- IOPS usage (read and write operation per second) and CPU IOWait
- Running containers graph by Swarm service and node
- Network usage graph (inbound Bps, outbound Bps)
- Nodes list (instance, node ID, node name)
Docker Swarm Services Dashboard
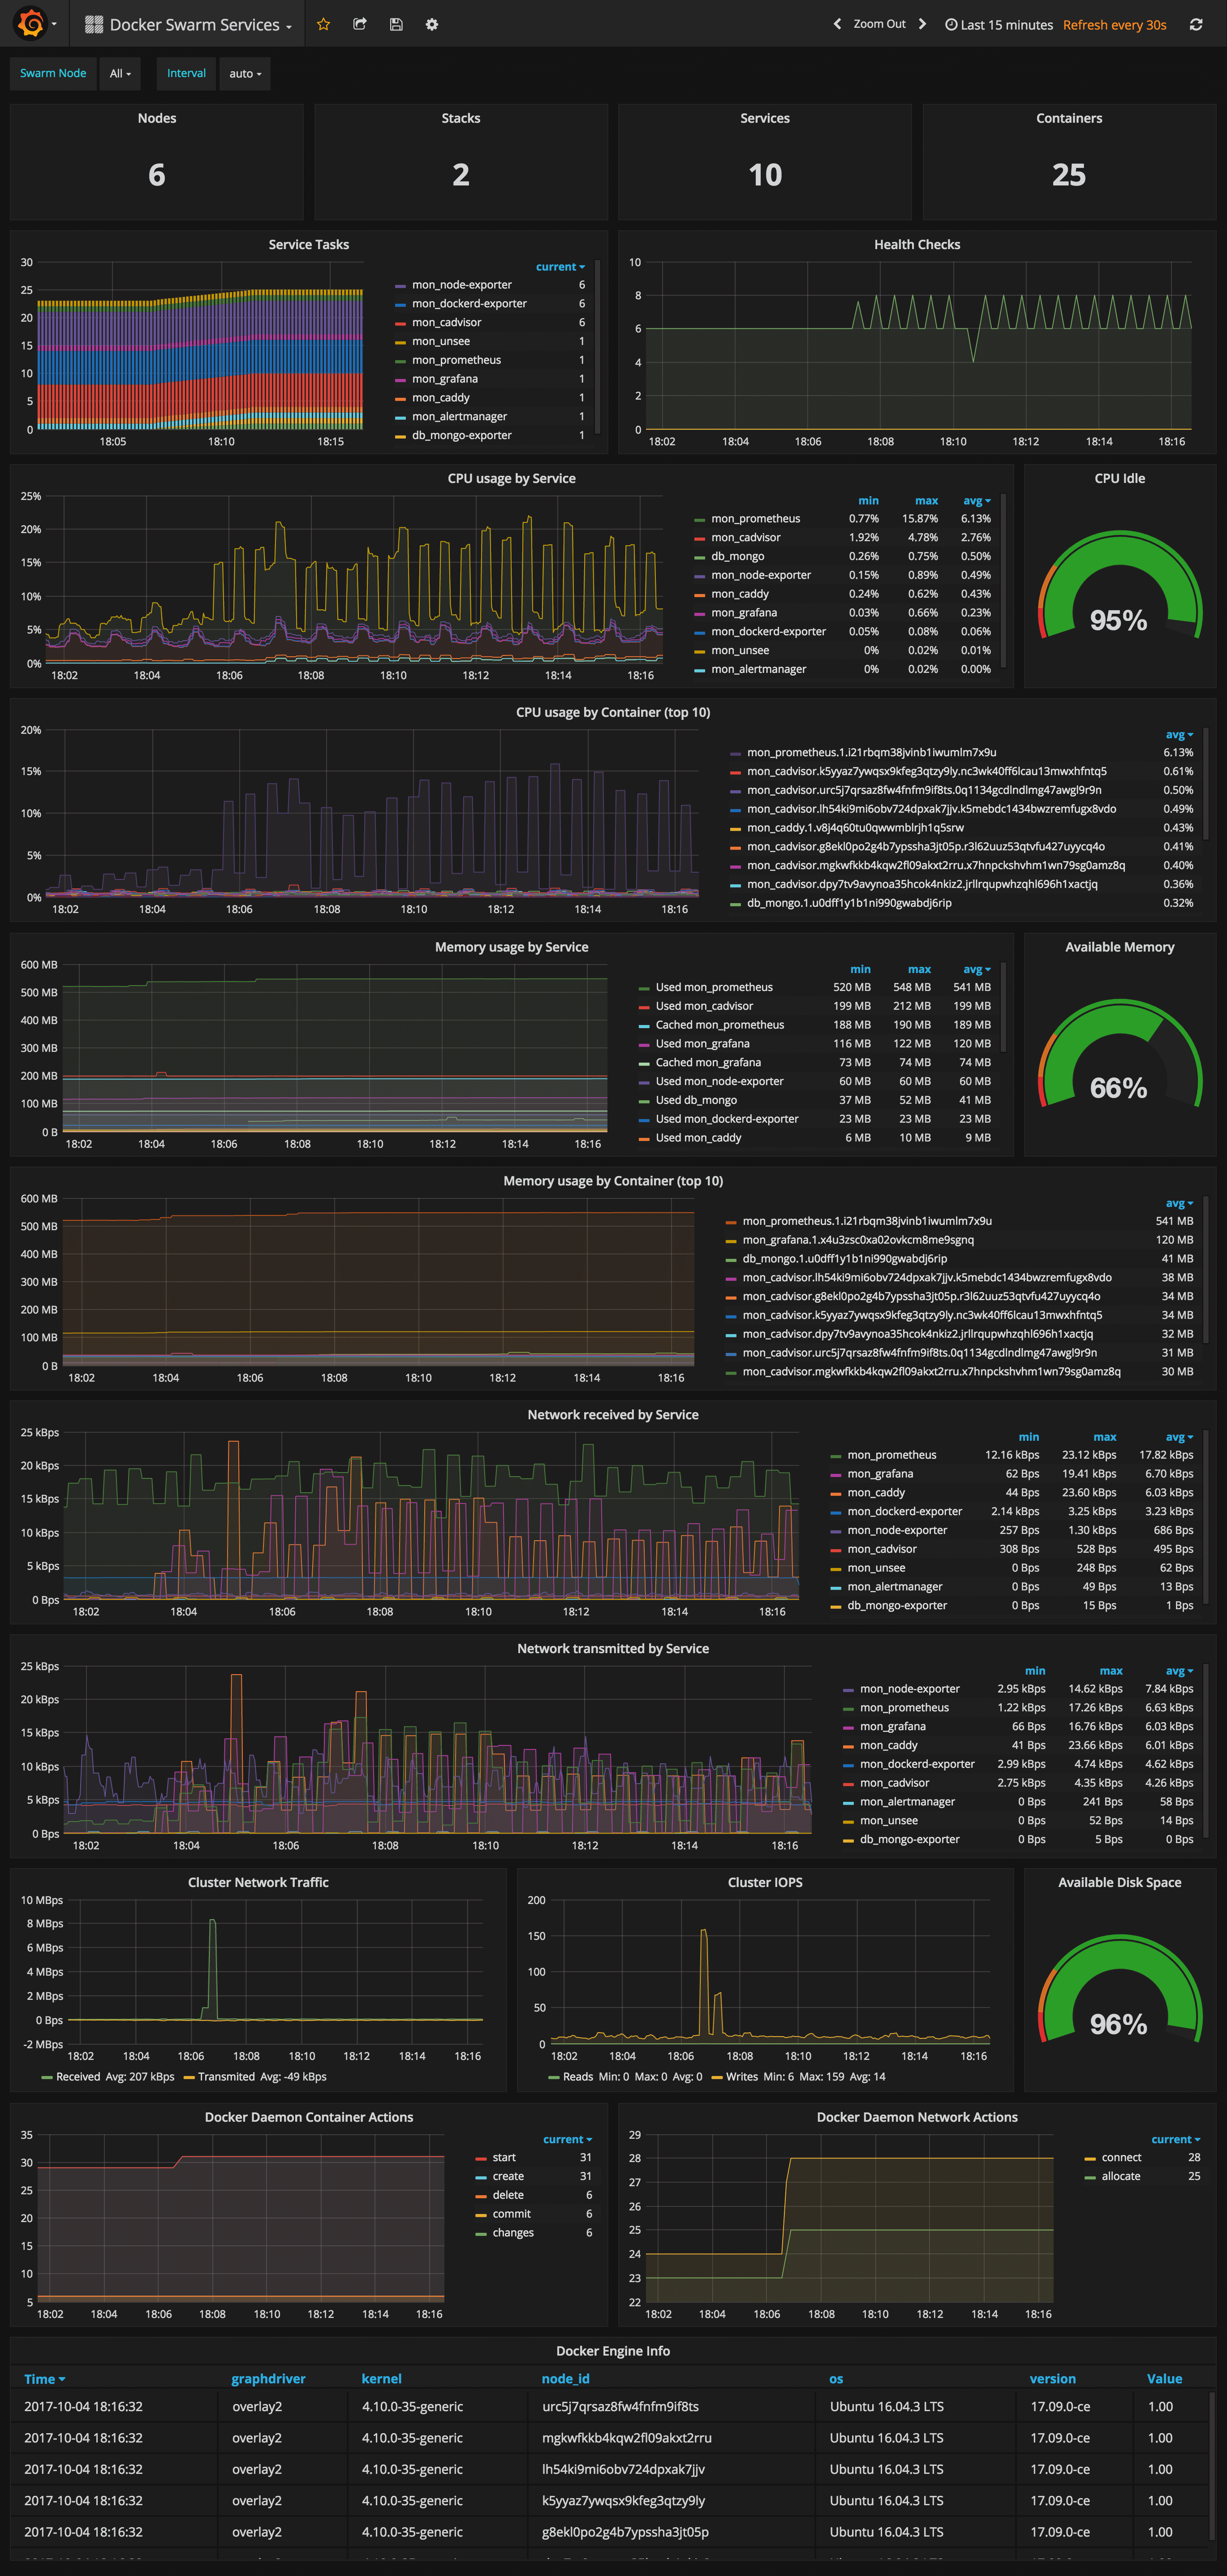
URL: http://<swarm-ip>:3000/dashboard/db/docker-swarm-services
This dashboard shows key metrics for monitoring the resource usage of your Swarm stacks and services, can be filtered by node ID:
- Number of nodes, stacks, services and running container
- Swarm tasks graph by service name
- Health check graph (total health checks and failed checks)
- CPU usage graph by service and by container (top 10)
- Memory usage graph by service and by container (top 10)
- Network usage graph by service (received and transmitted)
- Cluster network traffic and IOPS graphs
- Docker engine container and network actions by node
- Docker engine list (version, node id, OS, kernel, graph driver)
Prometheus Stats Dashboard
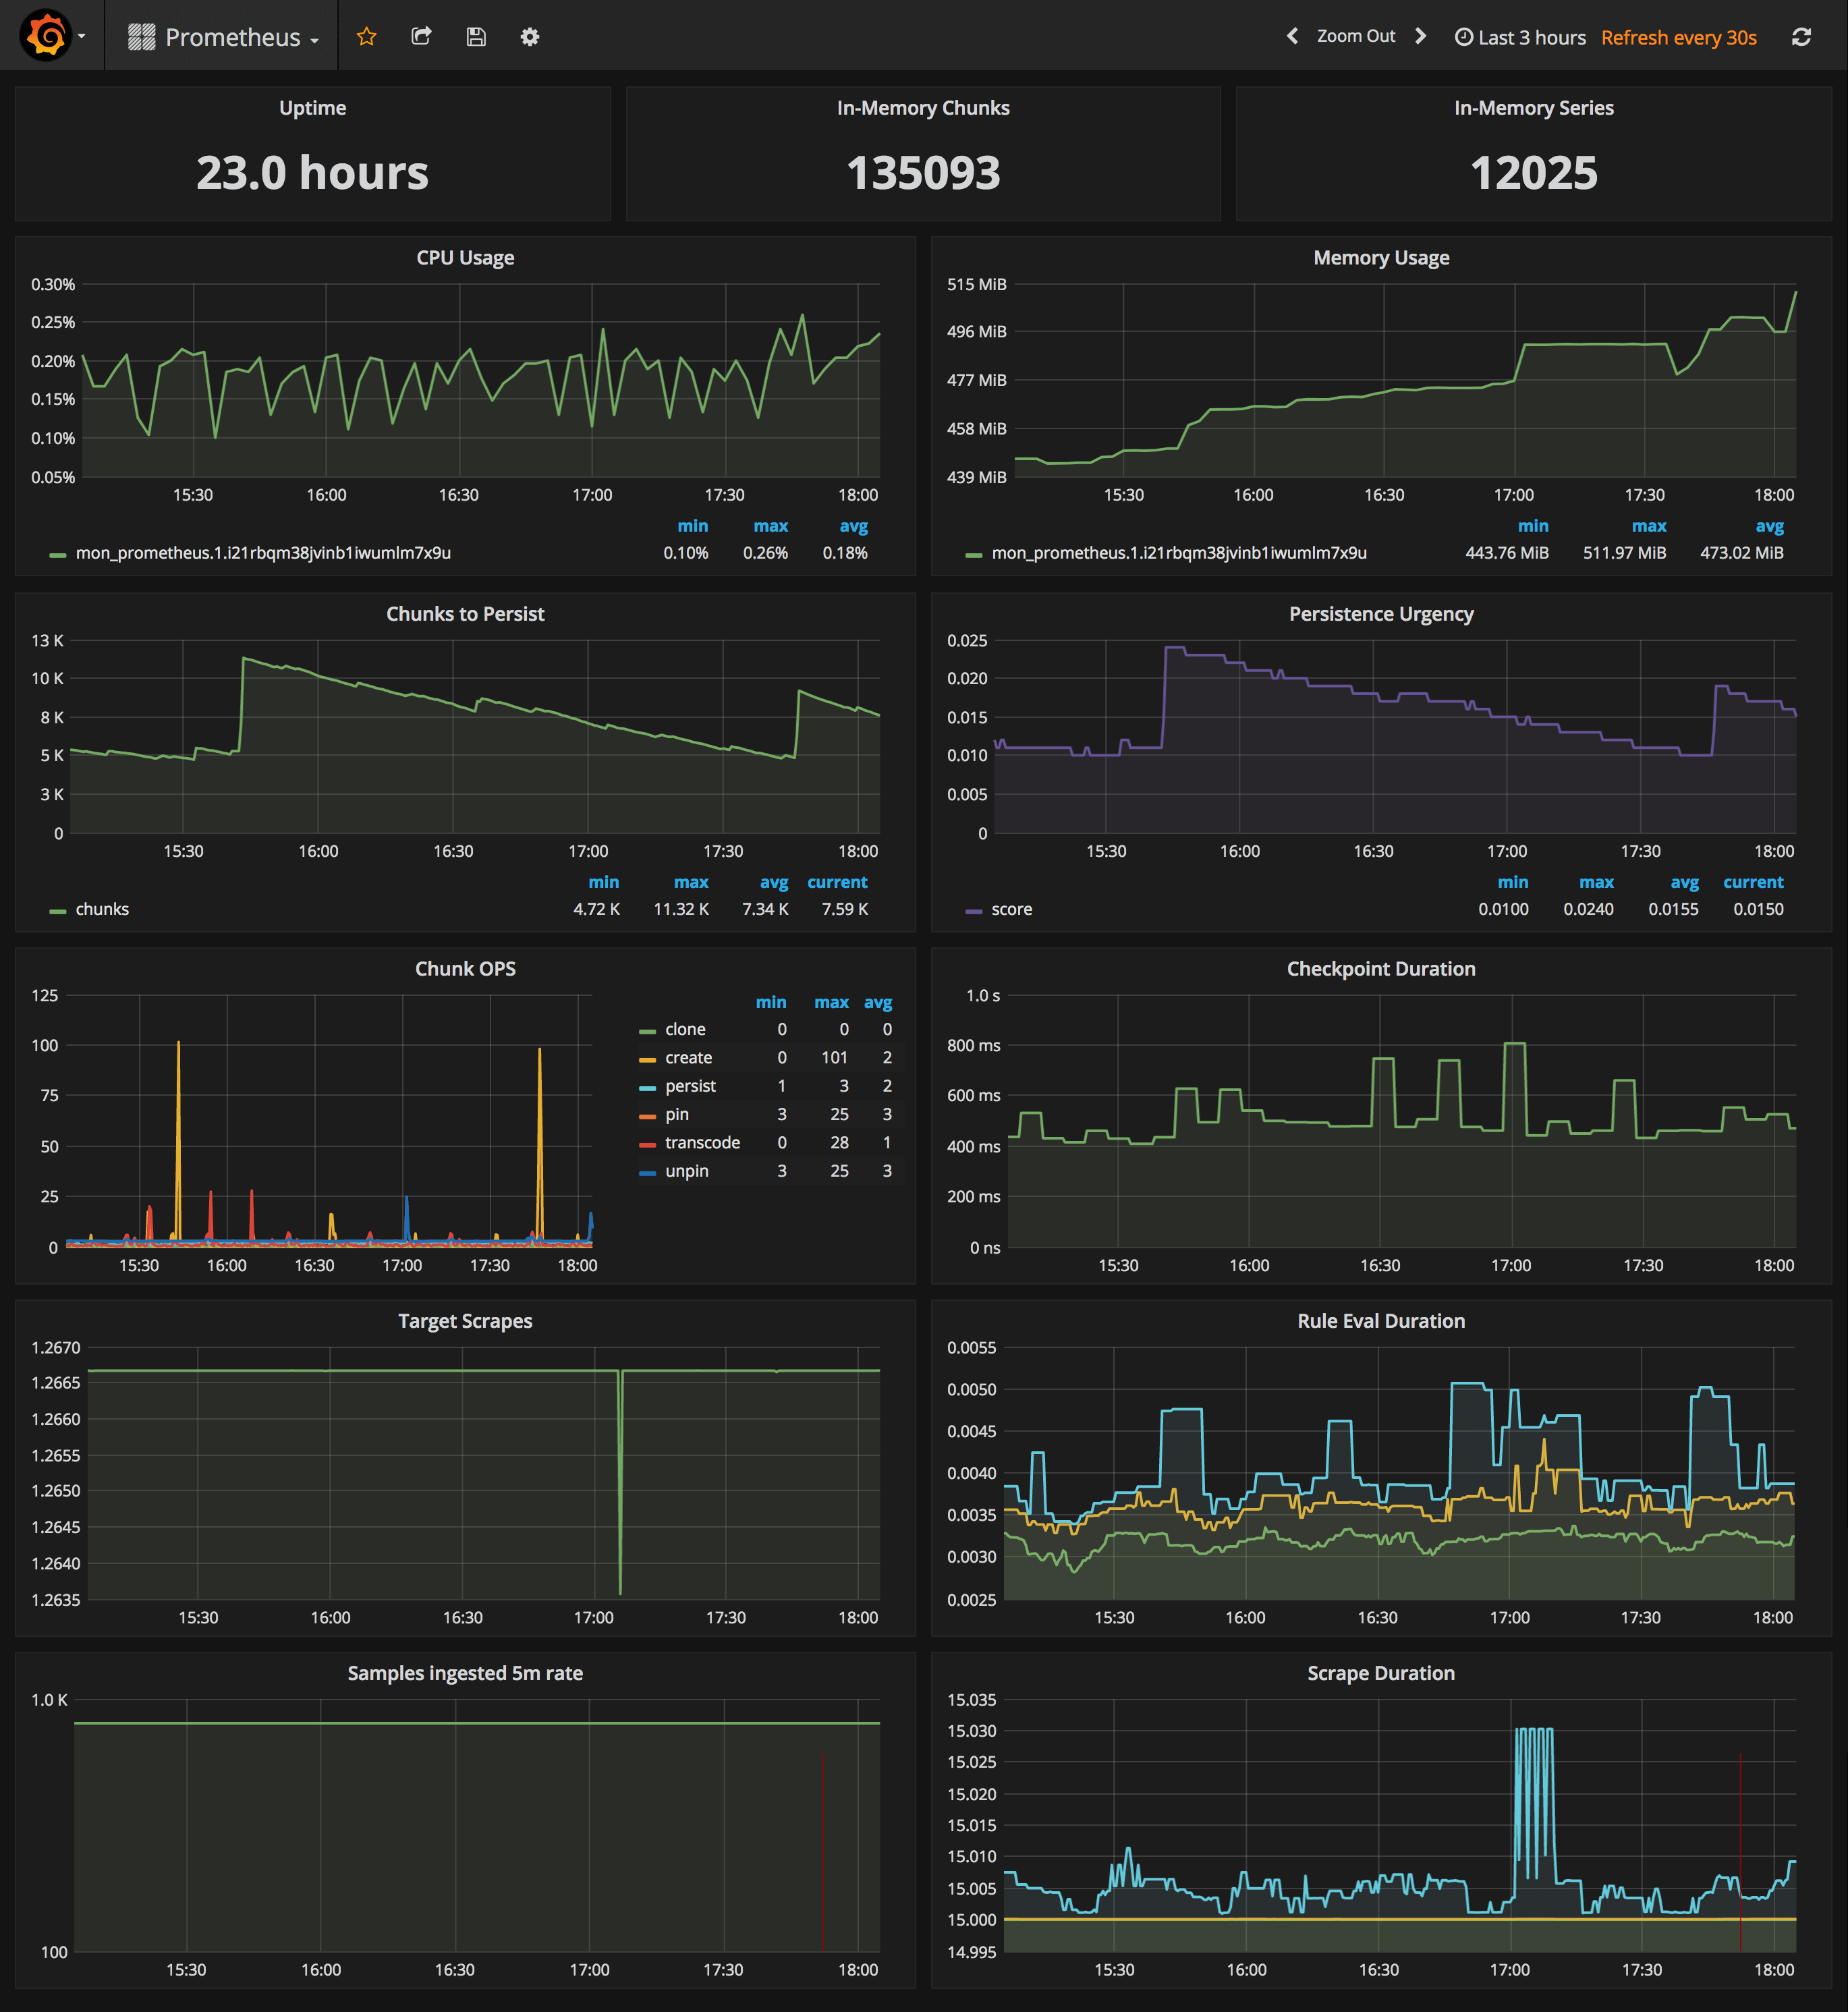
URL: http://<swarm-ip>:3000/dashboard/db/prometheus
- Uptime, local storage memory chunks and series
- CPU usage graph
- Memory usage graph
- Chunks to persist and persistence urgency graphs
- Chunks ops and checkpoint duration graphs
- Target scrapes, rule evaluation duration, samples ingested rate and scrape duration graphs
Prometheus configuration
I've set the Prometheus retention period to 24h and the heap size to 1GB, you can change these values in the compose file.
  prometheus:
    image: stefanprodan/swarmprom-prometheus
    command:
      - '-storage.local.target-heap-size=1073741824'
      - '-storage.local.retention=24h'
    deploy:
      resources:
        limits:
          memory: 2048M
        reservations:
          memory: 1024M
Set the heap size to a maximum of 50% of the total physical memory.
When using host volumes you should ensure that Prometheus doesn't get scheduled on different nodes. You can pin the Prometheus service on a specific host with placement constraints.
  prometheus:
    image: stefanprodan/swarmprom-prometheus
    volumes:
      - prometheus:/prometheus
    deploy:
      mode: replicated
      replicas: 1
      placement:
        constraints:
          - node.labels.monitoring.role == prometheus
Alert Manager configuration
The Prometheus swarmprom comes with Swarm nodes and services alerts. You can add alerts to swarm_node and swarm_task files and rerun stack deploy to update them.
The Alertmanager swarmprom image is configured with the Slack receiver. In order to receive alerts on Slack you have to provide the Slack API url, username and channel via environment variables:
  alertmanager:
    image: stefanprodan/swarmprom-alertmanager
    environment:
      - SLACK_URL=${SLACK_URL}
      - SLACK_CHANNEL=${SLACK_CHANNEL}
      - SLACK_USER=${SLACK_USER}
You can install the stress package with apt and test out the CPU alert, you should receive something like this:

Cloudflare has made a great dashboard for managing alerts.
Unsee can aggregate alerts from multiple Alertmanager instances, running either in HA mode or separate.
You can access unsee at http://<swarm-ip>:9094 using the admin user/password set via compose up.
Monitoring applications and backend services
You can extend swarmprom with special-purpose exporters for services like MongoDB, PostgreSQL, Kafka, Redis and also instrument your own applications using the Prometheus client libraries.
In order to scrape other services you need to attach those to the mon_net network so Prometheus
can reach them. Or you can attach the mon_prometheus service to the networks where your services are running.
Once your services are reachable by Prometheus you can add the dns name and port of those services to the
Prometheus config using the JOBS environment variable:
  prometheus:
    image: stefanprodan/swarmprom-prometheus
    environment:
      - JOBS=mongo-exporter:9216 kafka-exporter:9216 redis-exporter:9216
Monitoring production systems
The swarmprom project is meant as a starting point in developing your own monitoring solution. Before running this in production you should consider having redundancy for Prometheus and alert manager. You could run them as a service with two replicas pinned on different nodes, or even better, use a service like Weave Cloud Cortex to ship your metrics outside of your current setup. You can use Weave Cloud not only as a backup of your metrics database but you can also define alerts and use it as a data source four your Grafana dashboards. Having the alerting and monitoring system hosted on a different platform other than your production it's good practice that will allow your to react quickly and efficiently when a major disaster strikes.
Swarmprom comes with built-in Weave Cloud integration, you can find a more in-depth article on Swarmprom and Weave on weave.work blog.