A monitoring solution for Docker hosts, containers and containerized services
I've been looking for an open source self-hosted monitoring solution that can provide metrics storage, visualization and alerting for physical servers, virtual machines, containers and services that are running inside containers. After trying out Elastic Beats, Graphite and Prometheus I've settled-on Prometheus.
The main reason for choosing Prometheus was the support for multi-dimensional metrics and the query language that's easy to grasp. The fact that you can use the same language for graphing and alerting makes the monitoring task a whole lot easier. Prometheus handles blackbox probing as well as whitebox metrics meaning you can probe your infrastructure and also monitor the internal state of your applications.
Why choose Prometheus:
- The whole stack can be deployed using containers
- It's built for distributed systems and infrastructure
- Scalable data collection that doesn't rely on distributed storage
- Flexible service discovery (built in support for Kubernetes, Consul, EC2, Azure)
- Special-purpose exporters for services like HAProxy, MySQL, PostgreSQL, Memcached, Redis and many more
The Prometheus ecosystem is huge meaning you can find metrics exporters for a wide range of systems: from databases, MQ, HTTP servers to hardware related systems like IoT or IPMI. Whitebox monitoring also has great coverage. There are Prometheus client libraries for Go, Java, Python, Ruby, .NET, PHP and many more programming languages.
Getting started with Prometheus and Docker
If you want to try out the Prometheus stack, take a look at the dockprom repository on GitHub. You can use dockprom as a starting point in developing your own monitoring solution. With dockprom you can, run with one command, the whole stack: Prometheus, Grafana, cAdvisor, NodeExporter and AlertManager.
Install
Clone dockprom repository on your Docker host, cd into dockprom directory and run compose up:
git clone https://github.com/stefanprodan/dockprom
cd dockprom

ADMIN_USER=admin ADMIN_PASSWORD=admin docker-compose up -d
Containers:
- Prometheus (metrics database)
http://<host-ip>:9090 - AlertManager (alerts management)
http://<host-ip>:9093 - Grafana (visualize metrics)
http://<host-ip>:3000 - NodeExporter (host metrics collector)
- cAdvisor (containers metrics collector)
- Caddy (reverse proxy and basic auth provider for prometheus and alertmanager)
Setup Grafana
Navigate to http://<host-ip>:3000 and login with user admin password admin. You can change the credentials in the compose file or by supplying the ADMIN_USER and ADMIN_PASSWORD environment variables on compose up.
Grafana is preconfigured with dashboards and Prometheus as the default data source:
- Name: Prometheus
- Type: Prometheus
- Url: http://prometheus:9090
- Access: proxy
Docker Host Dashboard
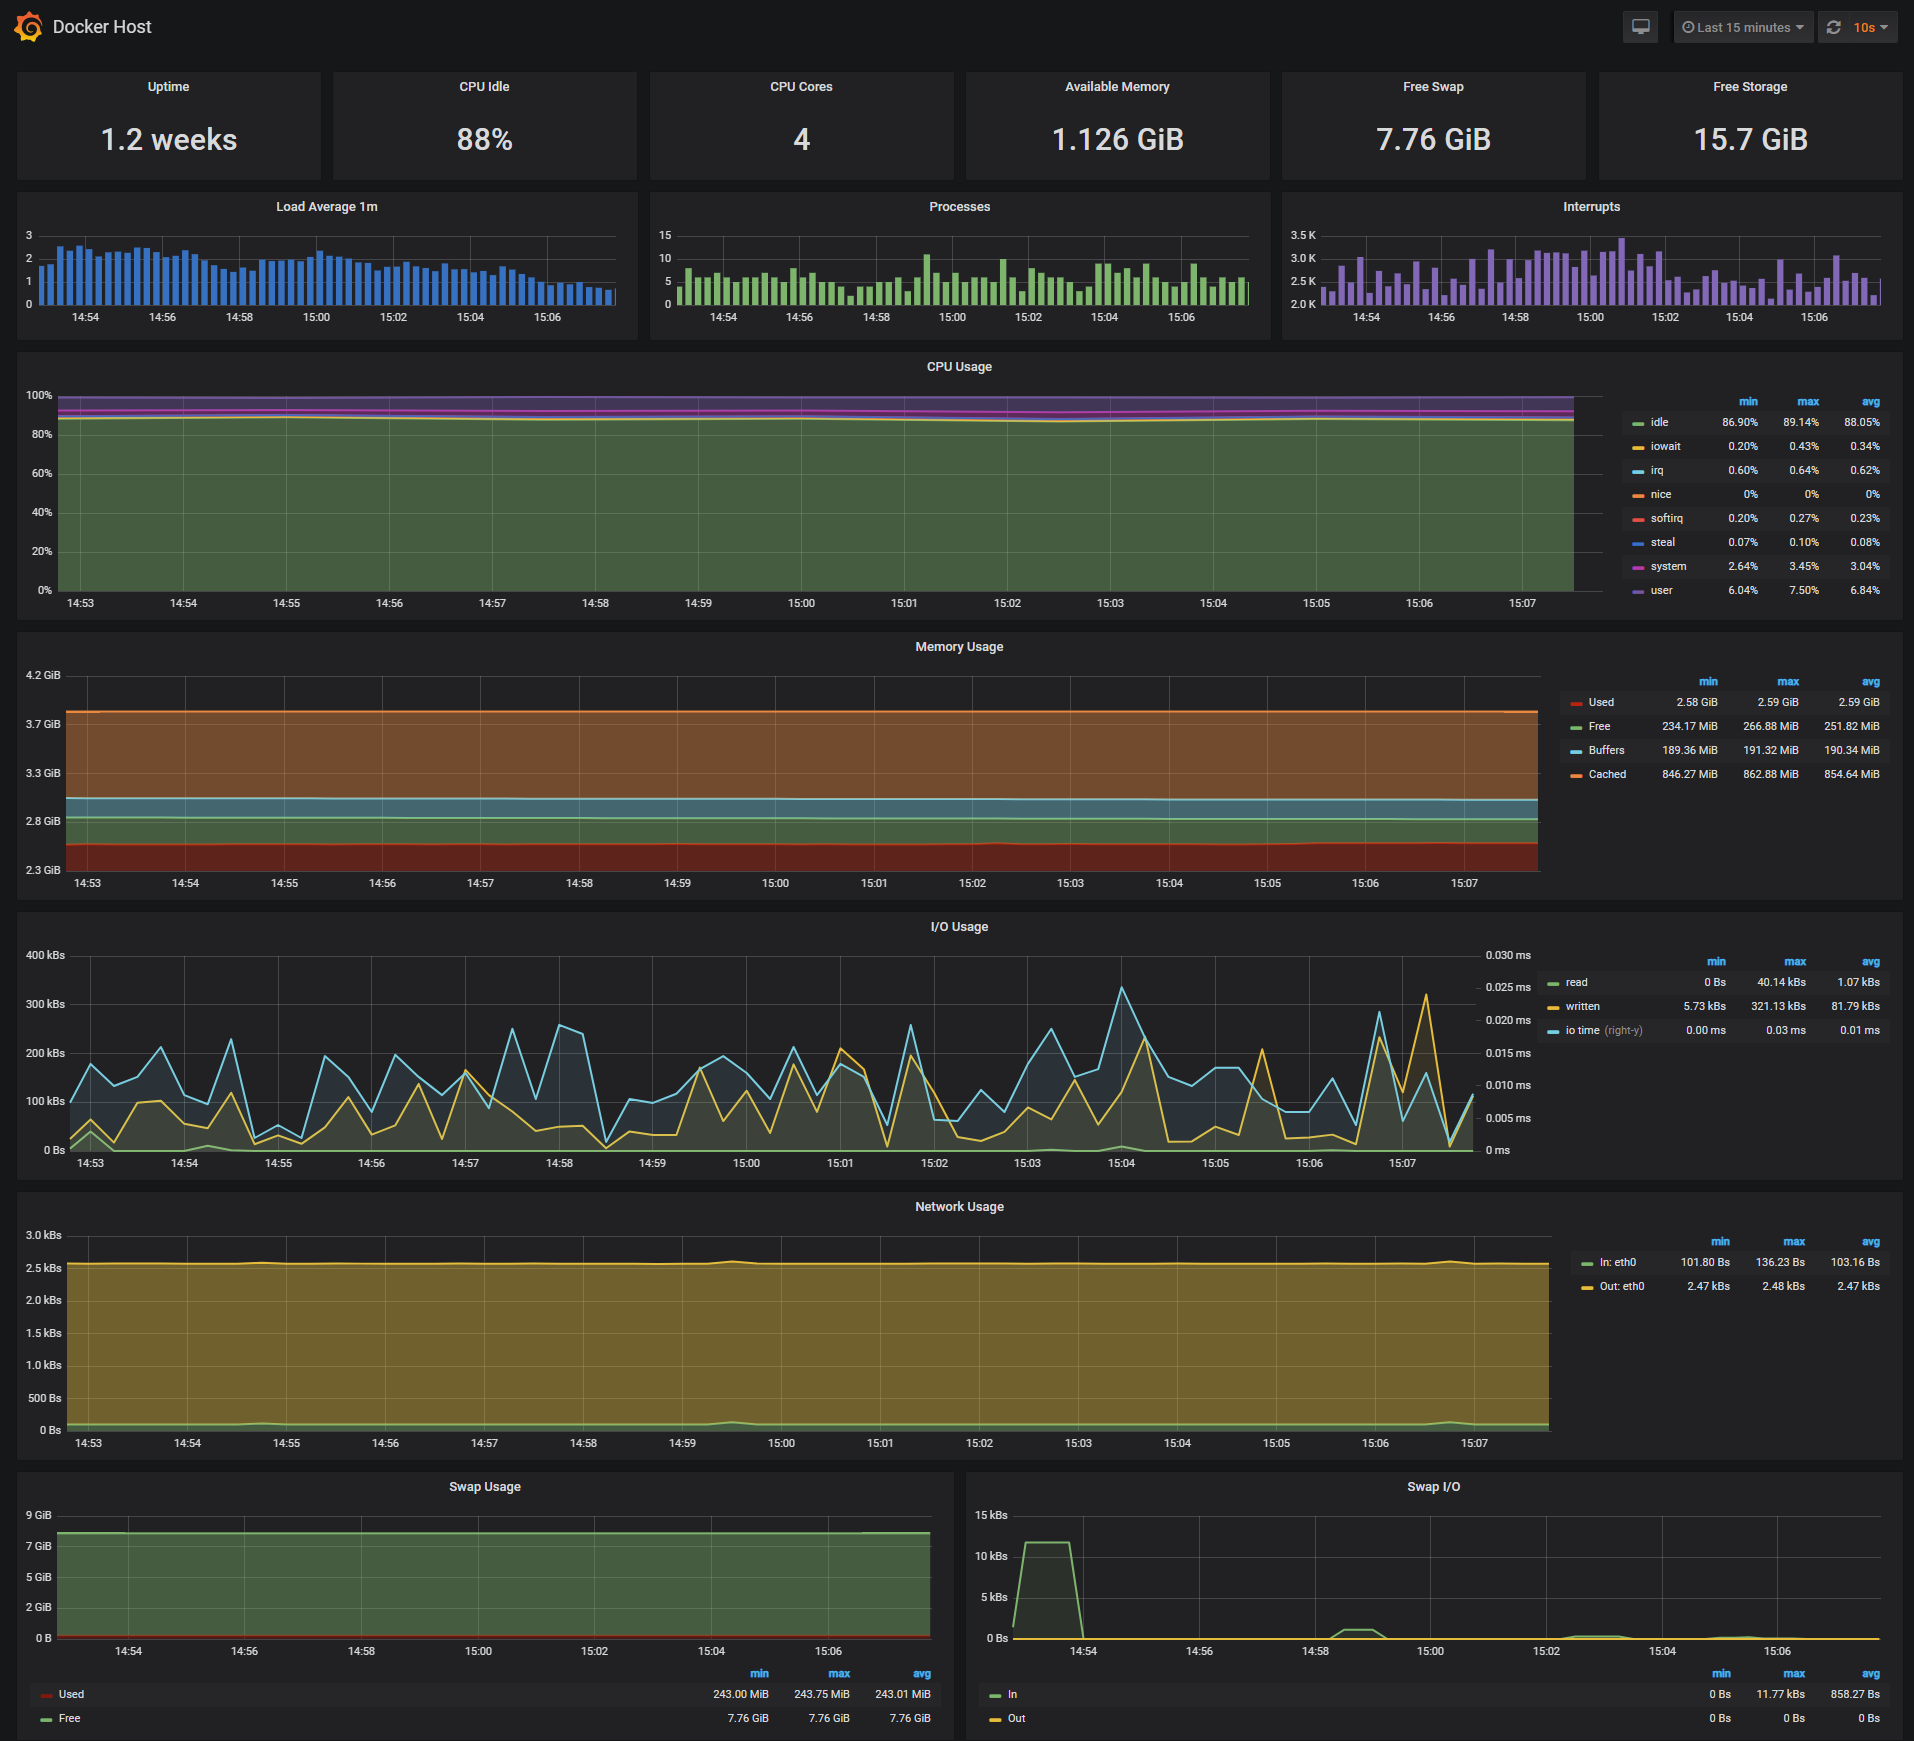
The Docker Host Dashboard shows key metrics for monitoring the resource usage of your server:
- Server uptime, CPU idle percent, number of CPU cores, available memory, swap and storage
- System load average graph, running and blocked by IO processes graph, interrupts graph
- CPU usage graph by mode (guest, idle, iowait, irq, nice, softirq, steal, system, user)
- Memory usage graph by distribution (used, free, buffers, cached)
- IO usage graph (read Bps, read Bps and IO time)
- Network usage graph by device (inbound Bps, Outbound Bps)
- Swap usage and activity graphs
Docker Containers Dashboard
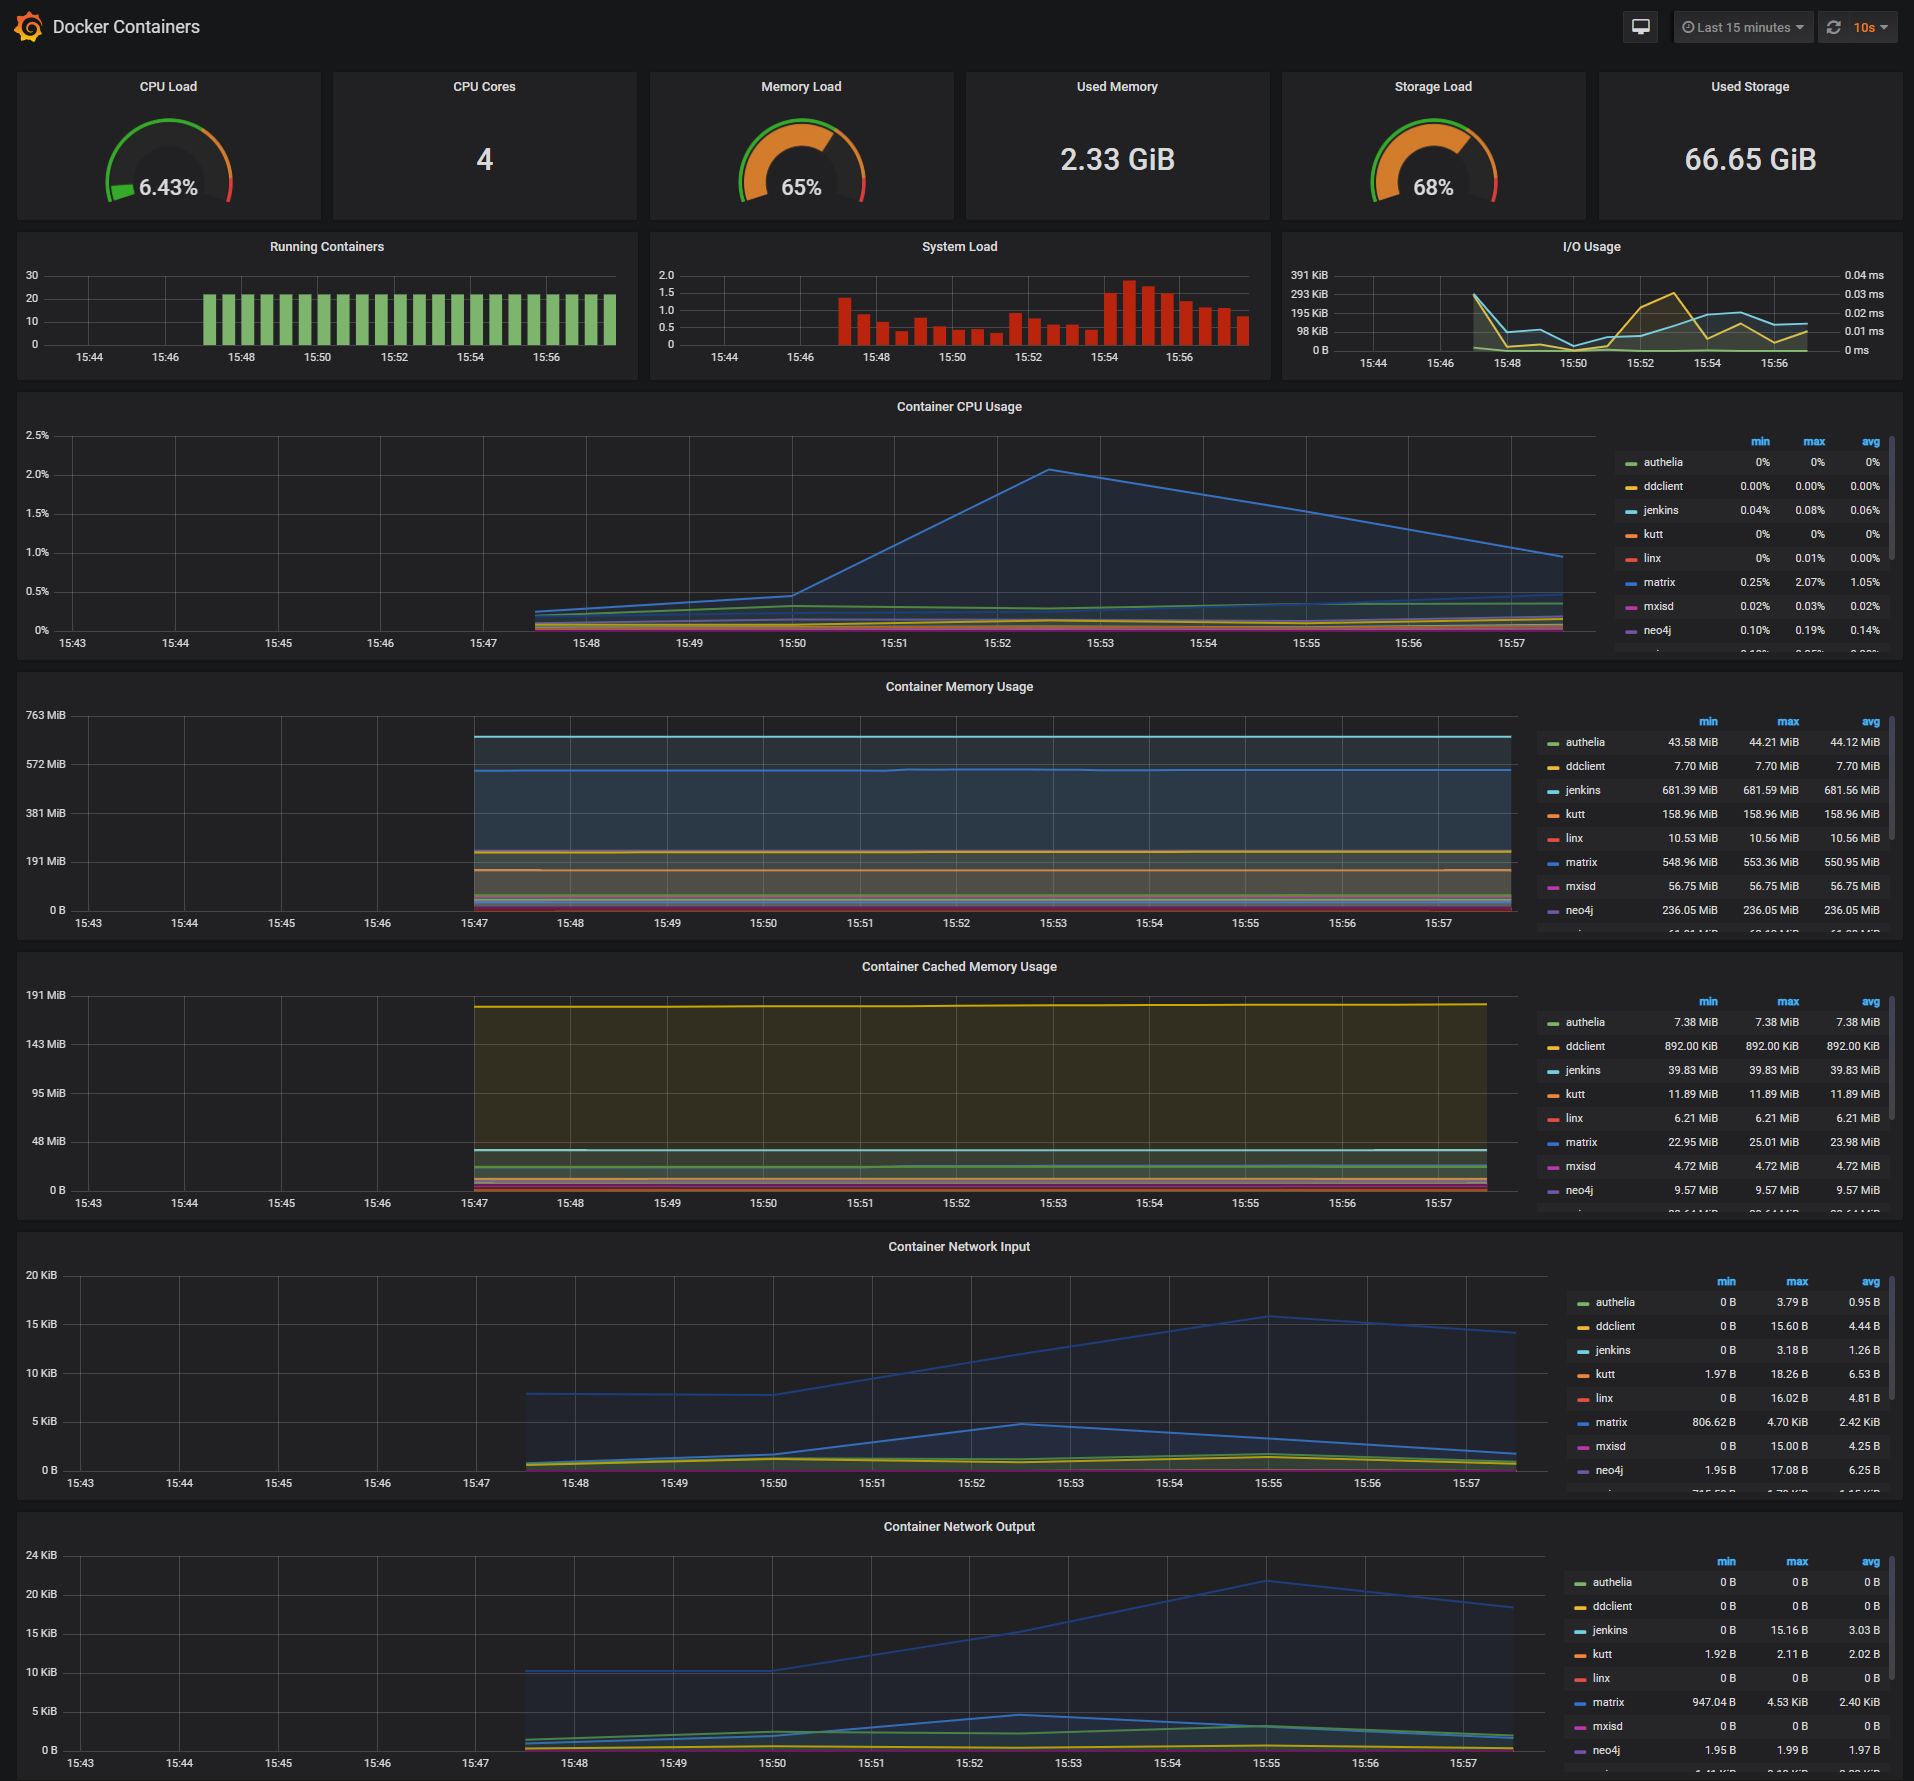
The Docker Containers Dashboard shows key metrics for monitoring running containers:
- Total containers CPU load, memory and storage usage
- Running containers graph, system load graph, IO usage graph
- Container CPU usage graph
- Container memory usage graph
- Container cached memory usage graph
- Container network inbound usage graph
- Container network outbound usage graph
Note that this dashboard doesn't show the containers that are part of the monitoring stack.
Monitor Services Dashboard
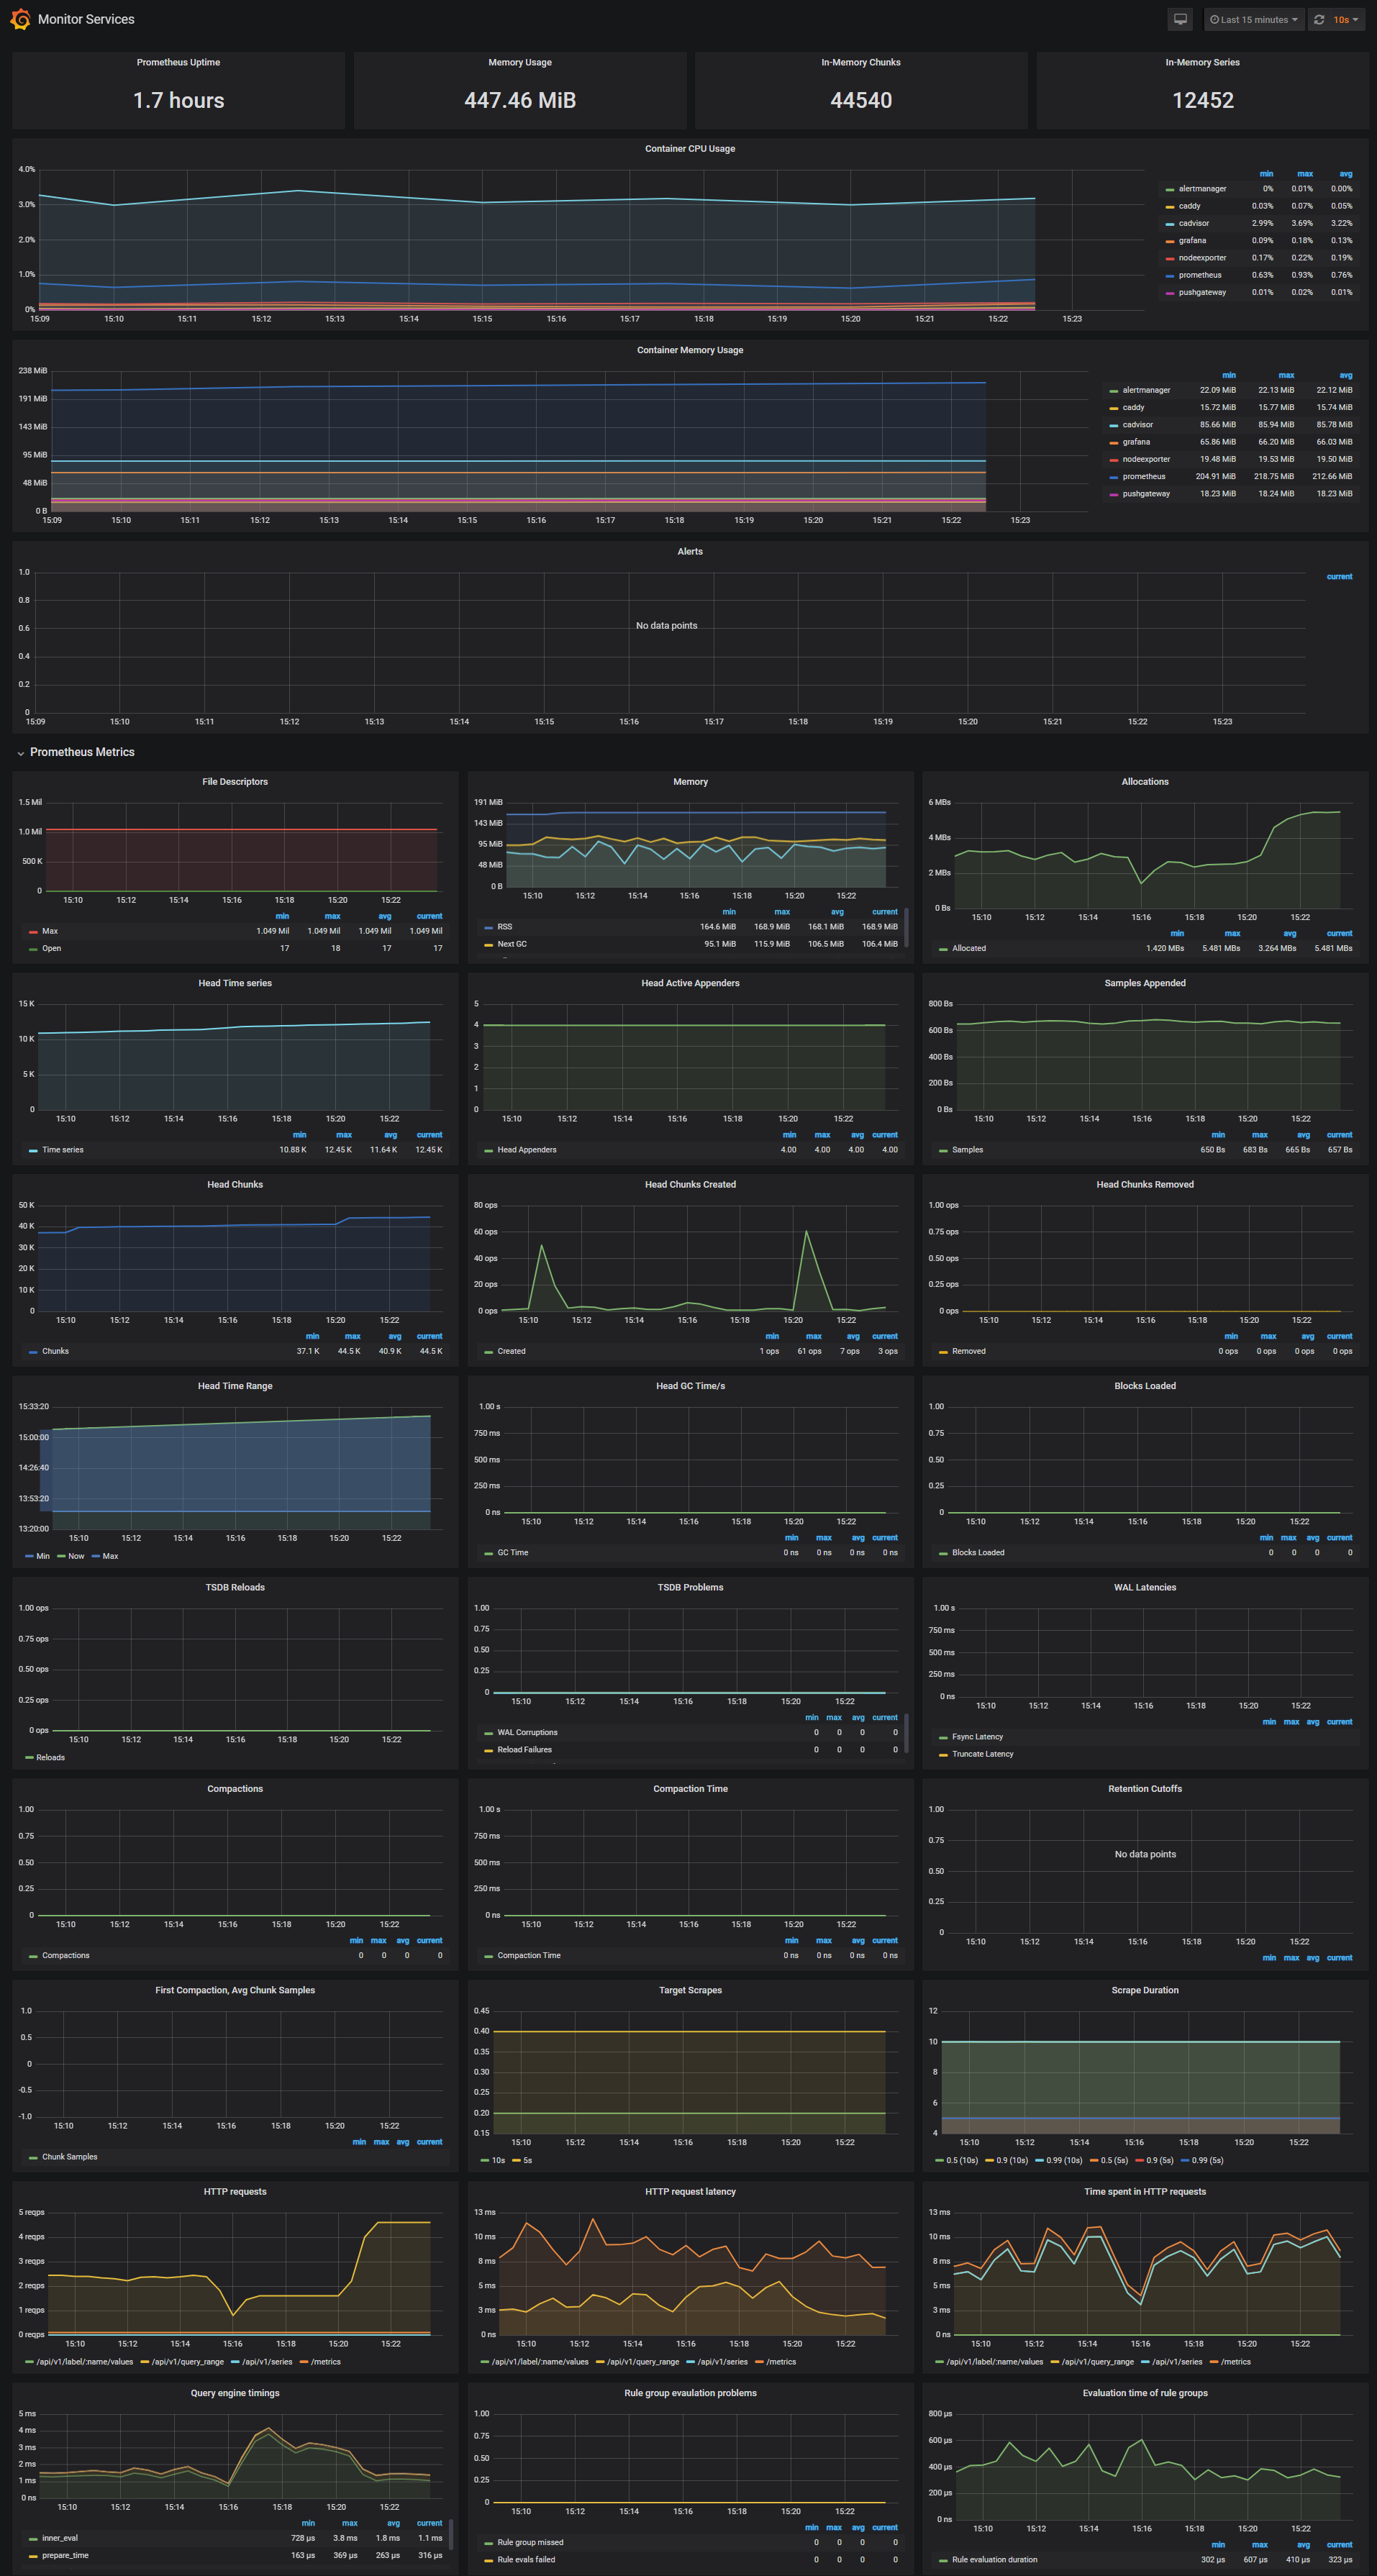
The Monitor Services Dashboard shows key metrics for monitoring the containers that make up the monitoring stack:
- Prometheus container uptime, monitoring stack total memory usage, Prometheus local storage memory chunks and series
- Container CPU usage graph
- Container memory usage graph
- Prometheus chunks to persist and persistence urgency graphs
- Prometheus chunks ops and checkpoint duration graphs
- Prometheus samples ingested rate, target scrapes and scrape duration graphs
- Prometheus HTTP requests graph
- Prometheus alerts graph
I've set the Prometheus retention period to 200h and the heap size to 1GB, you can change these values in the compose file.
  prometheus:
    image: prom/prometheus
    command:
      - '-storage.local.target-heap-size=1073741824'
      - '-storage.local.retention=200h'
Make sure you set the heap size to a maximum of 50% of the total physical memory.
Define alerts
I've setup three alerts configuration files:
- Monitoring services alerts targets.rules
- Docker Host alerts host.rules
- Docker Containers alerts containers.rules
You can modify the alert rules and reload them by making a HTTP POST call to Prometheus:
curl -X POST http://<host-ip>:9090/-/reload
Monitoring services alerts
Trigger an alert if any of the monitoring targets (node-exporter and cAdvisor) are down for more than 30 seconds:
ALERT monitor_service_down
  IF up == 0
  FOR 30s
  LABELS { severity = "critical" }
  ANNOTATIONS {
      summary = "Monitor service non-operational",
      description = "{% raw %}{{ $labels.instance }}{% endraw %} service is down.",
  }
Docker Host alerts
Trigger an alert if the Docker host CPU is under hight load for more than 30 seconds:
ALERT high_cpu_load
  IF node_load1 > 1.5
  FOR 30s
  LABELS { severity = "warning" }
  ANNOTATIONS {
      summary = "Server under high load",
      description = "Docker host is under high load, the avg load 1m is at {% raw %}{{ $value}}{% endraw %}. Reported by instance {% raw %}{{ $labels.instance }}{% endraw %} of job {% raw %}{{ $labels.job }}{% endraw %}.",
  }
Modify the load threshold based on your CPU cores.
Trigger an alert if the Docker host memory is almost full:
ALERT high_memory_load
  IF (sum(node_memory_MemTotal) - sum(node_memory_MemFree + node_memory_Buffers + node_memory_Cached) ) / sum(node_memory_MemTotal) * 100 > 85
  FOR 30s
  LABELS { severity = "warning" }
  ANNOTATIONS {
      summary = "Server memory is almost full",
      description = "Docker host memory usage is {% raw %}{{ humanize $value}}{% endraw %}%. Reported by instance {% raw %}{{ $labels.instance }}{% endraw %} of job {% raw %}{{ $labels.job }}{% endraw %}.",
  }
Trigger an alert if the Docker host storage is almost full:
ALERT hight_storage_load
  IF (node_filesystem_size{fstype="aufs"} - node_filesystem_free{fstype="aufs"}) / node_filesystem_size{fstype="aufs"}  * 100 > 85
  FOR 30s
  LABELS { severity = "warning" }
  ANNOTATIONS {
      summary = "Server storage is almost full",
      description = "Docker host storage usage is {% raw %}{{ humanize $value}}{% endraw %}%. Reported by instance {% raw %}{{ $labels.instance }}{% endraw %} of job {% raw %}{{ $labels.job }}{% endraw %}.",
  }
Docker Containers alerts
Trigger an alert if a container is down for more than 30 seconds:
ALERT jenkins_down
  IF absent(container_memory_usage_bytes{name="jenkins"})
  FOR 30s
  LABELS { severity = "critical" }
  ANNOTATIONS {
    summary= "Jenkins down",
    description= "Jenkins container is down for more than 30 seconds."
  }
Trigger an alert if a container is using more than 10% of total CPU cores for more than 30 seconds:
 ALERT jenkins_high_cpu
  IF sum(rate(container_cpu_usage_seconds_total{name="jenkins"}[1m])) / count(node_cpu{mode="system"}) * 100 > 10
  FOR 30s
  LABELS { severity = "warning" }
  ANNOTATIONS {
    summary= "Jenkins high CPU usage",
    description= "Jenkins CPU usage is {% raw %}{{ humanize $value}}{% endraw %}%."
  }
Trigger an alert if a container is using more than 1,2GB of RAM for more than 30 seconds:
ALERT jenkins_high_memory
  IF sum(container_memory_usage_bytes{name="jenkins"}) > 1200000000
  FOR 30s
  LABELS { severity = "warning" }
  ANNOTATIONS {
      summary = "Jenkins high memory usage",
      description = "Jenkins memory consumption is at {% raw %}{{ humanize $value}}{% endraw %}.",
  }
Setup alerting
The AlertManager service is responsible for handling alerts sent by Prometheus server. AlertManager can send notifications via email, Pushover, Slack, HipChat or any other system that exposes a webhook interface. A complete list of integrations can be found here.
You can view and silence notifications by accessing http://<host-ip>:9093.
The notification receivers can be configured in alertmanager/config.yml file.
To receive alerts via Slack you need to make a custom integration by choose incoming web hooks in your Slack team app page. You can find more details on setting up Slack integration here.
Copy the Slack Webhook URL into the api_url field and specify a Slack channel.
route:
    receiver: 'slack'

receivers:
    - name: 'slack'
      slack_configs:
          - send_resolved: true
            text: "{% raw %}{{ .CommonAnnotations.description }}{% endraw %}"
            username: 'Prometheus'
            channel: '#<channel>'
            api_url: 'https://hooks.slack.com/services/<webhook-id>'
Extending the monitoring system
Dockprom Grafana dashboards can be easily extended to cover more then one Docker host. In order to monitor more hosts, all you need to do is to deploy a node-exporter and a cAdvisor container on each host and point the Prometheus server to scrape those.
You should run a Prometheus stack per data center/zone and use the federation feature to aggregate all metrics in a dedicated Prometheus instance that will serve as an overview of your whole infrastructure. This way, if a zone goes down or the Prometheus instance that does the zones aggregation goes down, your monitoring system present on the remaining zones can still be accessed.
You can also make Prometheus highly available by running two identical Prometheus servers in each zone. Having multiple servers pushing alerts to the same Alertmanager will not result in duplicate alerts, since Alertmanager does deduplication.
If you have any suggestion on improving dockprom please submit an issue or PR on GitHub. Contributions are more than welcome!